Gantt Charts
Critical Path
The longest sequence of activities in a project that must be completed to be on time.
Slippage
What has actually happened compared with what should have happened.
- What if there are two critical paths?
- What if you have tasks that you want to overlap?
Granulate a Task
Cut it into smaller parts.
Task Link
- Finish - Start
- Start - Start
- Finish - Finish
- Start - Finish
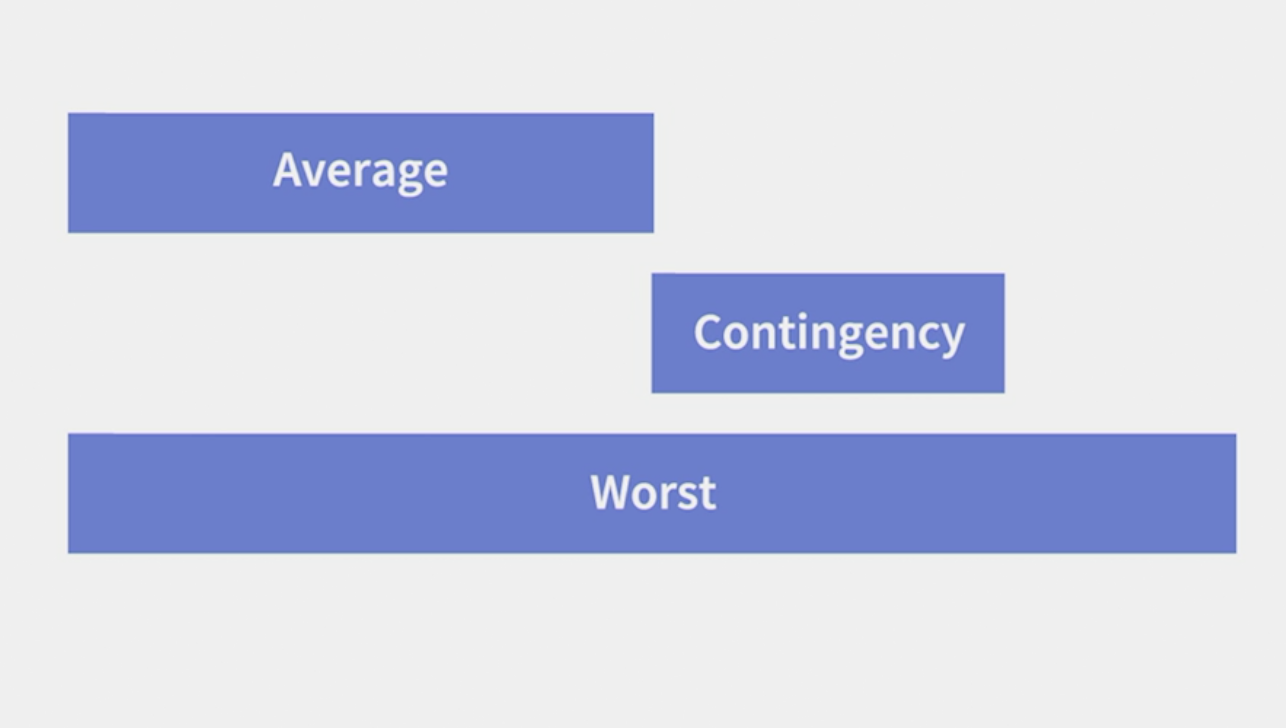
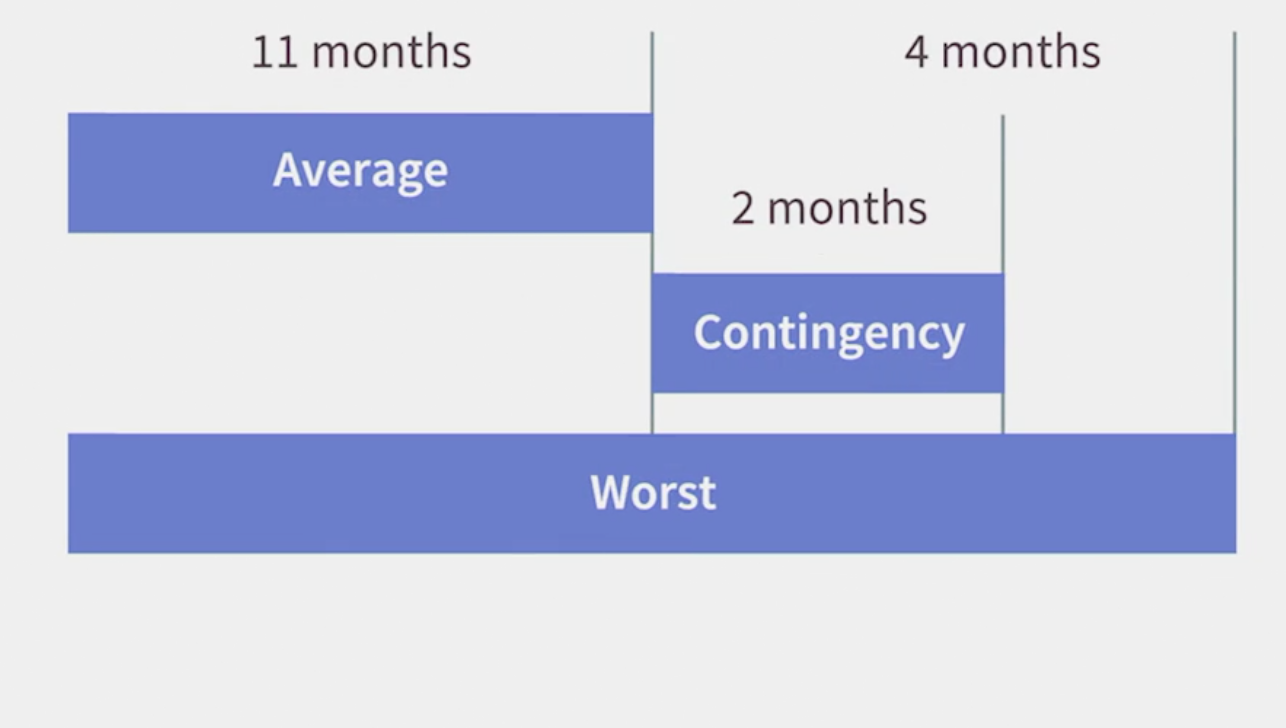
- Spread the contingency through your critical path, adding a little bit to each task.
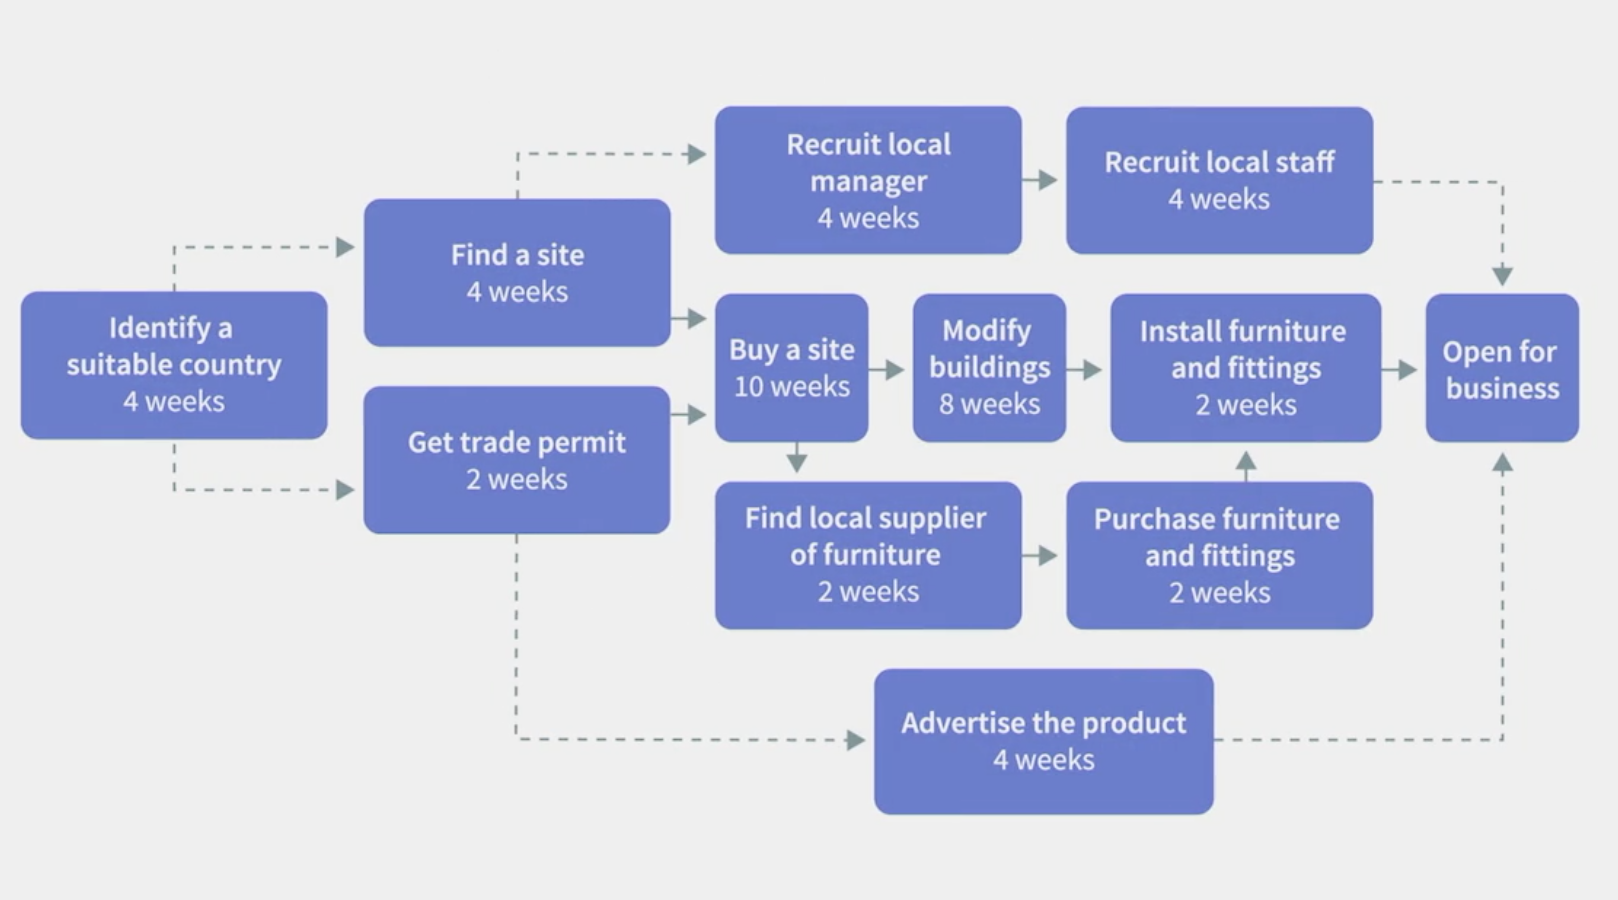
- Network Diagram - Gantt Charts
- Risks in Your Gantt Chart
- If there are much 1 day work, it will never happen in real world
- If floating task nearly critical, should pay attention
- Too much short tasks at the end(need to add time)
Granularity
The degree to which tasks are broken down
- Double-check the connections between tasks as you progress.
- Does the network diagram look right?
Check Your Plan
- Too many tasks? (30+)
- Any task larger than the others?
- Any flurry of small tasks at the end?
- A good mix of series and parallel?
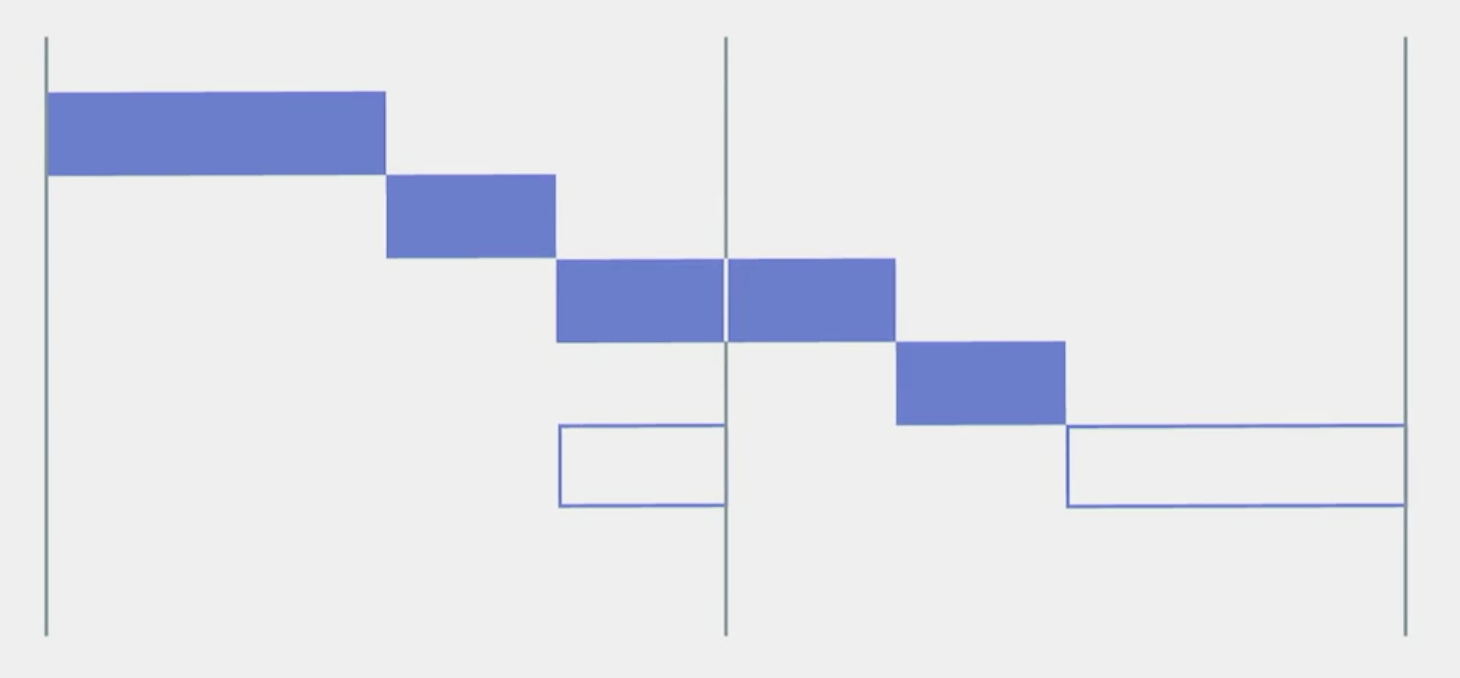
Putting in and positioning the floating tasks
Floating Tasks
- Add vertical lines
- Okay to share a float
- Floaters may depend on other floaters.
- Decide to float earlier or later
- Neater is easier to understand
Assessing the software options
Microsofe Excel
- Sharing
- Adding up costs and time
- Planning resources for multiple projects
How to leverage a Gantt Chart
Before I promise anything, I need to do a bit of planning, which I think you'll agree, is a reasonable thing to do.
Kickoff meeting
- See roles
- Commit to responsibilities
Verify Commitments
Two steps
- What we're going to plan
- sign off on the plan
Using a Gantt chart to plan resources for one project
Units of Measure for Resource Plan
- Hours per week
- Person days per week or month
- Number of people(FTEs) per week/month
Gantt of Gantts
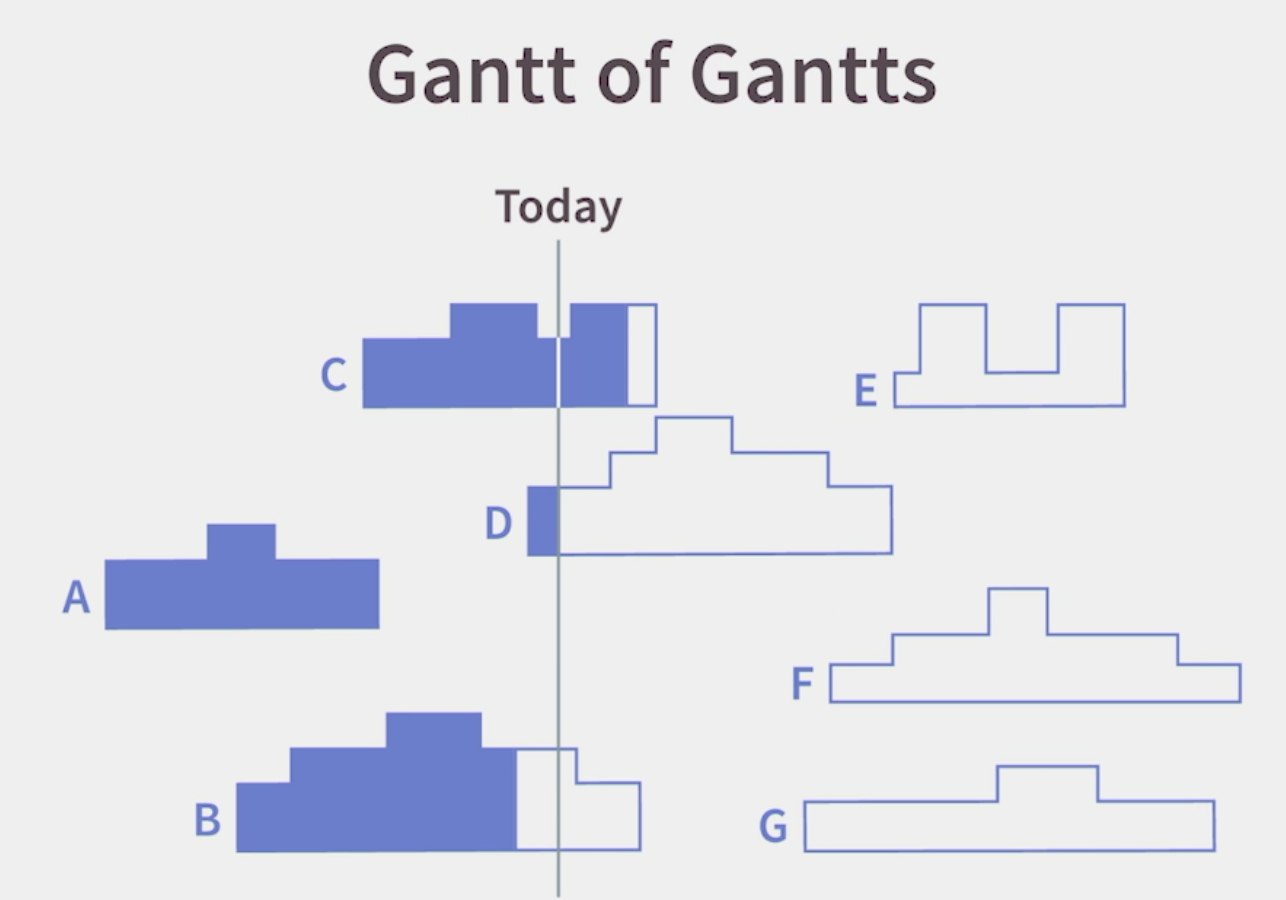
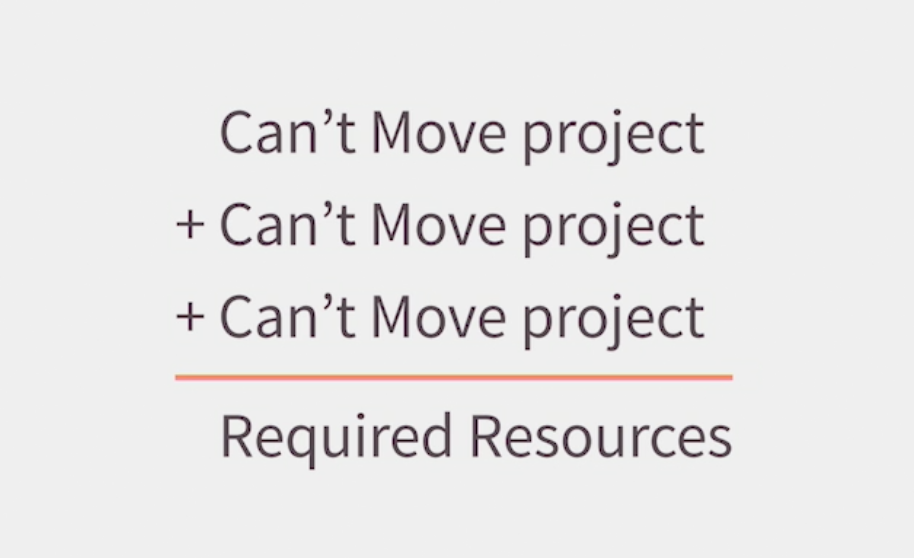
Resource Planning
Network diagram
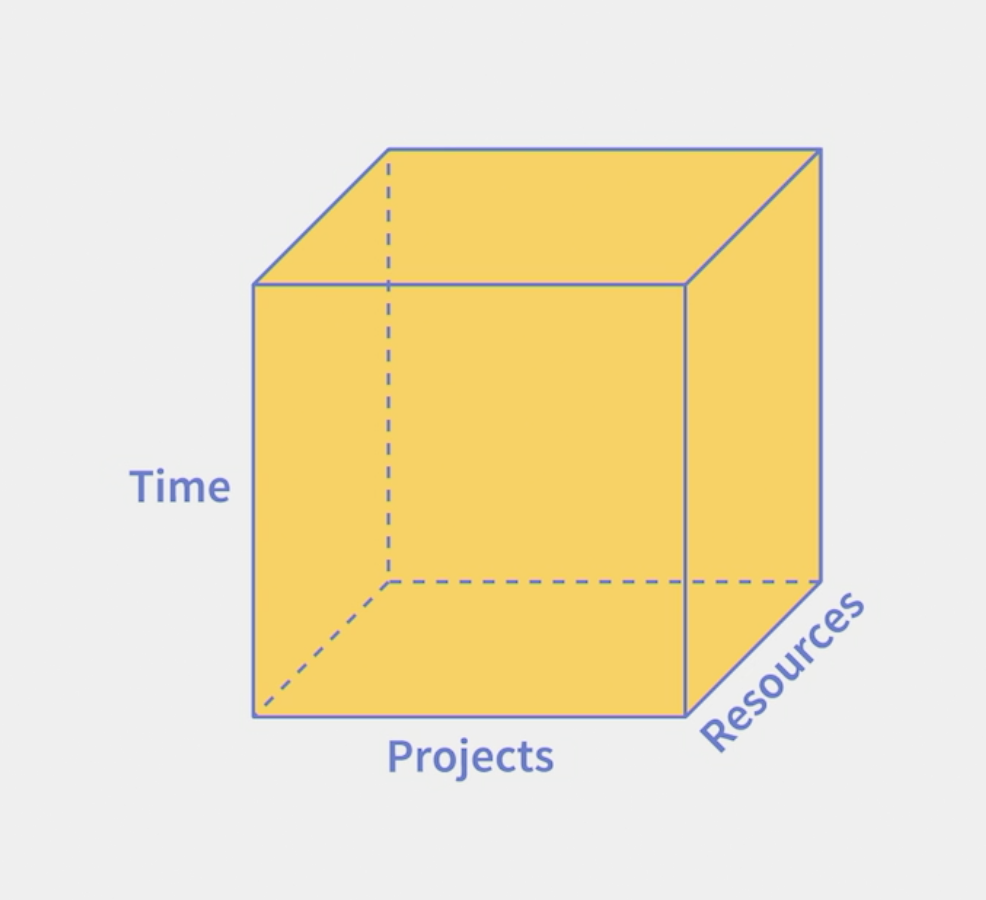
- Identify bottleneck resources
- Look at time and projects
Monitoring progress with a Gantt chart
Assessing risk with a Gantt Chart
Risk
- Lateness
- Overspend
- consider the cost risks of all tasks
Speeding up your project with Gantt Chart
Speed up: First Half
- Increase resources
- Reduce quality
- Overlap tasks
Crashing the Project
- Increase resources
- Reduce quality
- Overlap tasks
Speed up: Second Half
- Increase resources
- Reduce quality
- Overlap tasks
- Let it slip
Only reschedule once.
Ask for more than a repeat of the first half.
Forecasting spend with a Gantt chart
Predicting Spend
Forecasting Challenge
Forecast Cost at Completion(FCC)
An estimate of the project's final cost
Challenge
- Estimate the final cost
- Predict the date of completion
Forecasting Solution
Optimist View
Pessimist View
Five common mistake
- Jumping straight to the Gantt Chart
- Getting the wrong level of granularity
- Forgetting Contingency
- Neglecting the Gantt chart once you've started
- Changing your plan more than once
Course
- Project Management Simplified
- Project Management: Solving Common Project Problems