Section 4.5 Logging
As you study this section, answer the following questions:
- When are logs generated?
- Which log type records information related to system access?
- What are the two types of event subscriptions?
In this section, you will learn to:
- Log events with pfSense
- Evaluate event logs in pfSense
- Evaluate Windows log files
The key terms for this section include:
| Term | Definition |
|---|---|
| Logs | A record of events on a system (also referred to as audit trails). |
| Event subscription | Events from a source (forwarder) computer that are sent to a collector computer. |
| Access log | Records information related to system access (also known as a security log). |
| Performance log | Records information about the use of system resources, such as printers and servers. |
| Firewall log | Identifies allowed and blocked traffic, active ports, and bandwidth. |
| Web application firewall log (WAF) | A log used to filter HTTP traffic at the Application layer. The logs record information related to HTTP traffic. |
| Intrusion detection system (IDS) | A system used to analyze packets for malicious traffic. It is a passive system that alerts administrators of high-priority events. |
| Intrusion prevention system (IPS) | An active system that blocks malicious traffic. IDS/IPS logs are created any time an event rule has been matched. |
This section helps you prepare for the following certification exam objectives:
| Exam | Objective |
|---|---|
| CompTIA CySA+ CS0-003 | 1.1 Explain the importance of system and network architecture concepts in security operations
1.2 Given a scenario, analyze indicators of potentially malicious activity
1.3 Given a scenario, use appropriate tools or techniques to determine malicious activity
3.2 Given a scenario, perform incident response activities
|
| TestOut CyberDefense Pro | 1.3 Implement logging
|
4.5.1 Log Review Overview
Click one of the buttons to take you to that part of the video.
Log Review 00:00-00:23 In this lesson, we're going to talk about logs. Logs, or audit trails, are a record of events on a system. Logging capabilities are built into operating systems, services, and applications. Log entries are generated in response to configuration changes, changes in system state, or network conditions.
Log Review Best Practices 00:23-01:27 Logs can contain massive amounts of information, so there are several best practices for creating and reviewing them. First, for a log to be useful, it needs to be analyzed. Piles of data sitting on a server won't do you much good if you don't take the time to analyze the logs for patterns and suspicious activity.
Second, log content should be strategic. Logs should show a narrow view of information. If a log contains too much information, issues are buried in data, and you have to dig to find them. Additionally, logging requires system resources - processor, memory, and disk space. Carefully assess the amount of logging you need for system security. If you don't need something, you probably shouldn't waste the resources to obtain it.
Third, be sure to address all suspicious activity. You should always promptly resolve or report any suspicious or unauthorized activity the logs reveal. Lastly, keep in mind that some logs may be a violation of user privacy, so to avoid privacy conflicts, make sure that auditing applies to all users and make users aware that their activity is audited.
Log Types 01:27-04:09 Now let's talk about the types of logs available to you. Access logs record information-related system access, such as each time a user attempts to log in, incorrect password usage, and the employment of user rights.
Performance logs record information about the use of system resources, such as printers or servers, at regular intervals. A firewall log identifies allowed traffic, blocked traffic, ports in use, and bandwidth in use. Firewalls collect a huge amount of data and do not have a lot of storage space, so all data should be collected so the information is not lost when it rolls over.
A web application firewall is used to filter HTTP traffic at the application layer. A web application firewall log reviews response and request headers, reviews HTML messages, and logs information about suspicious traffic. A proxy is often used to forward HTTP requests to their destinations. A review of proxy logs could help to determine the user, request method, and content of the HTTP requests.
An intrusion detection system, or IDS, is used to analyze packets for malicious traffic. It is a passive system that alerts administrators of high-priority events. An IDS can also be used as an intrusion prevention system, or IPS. An IPS will block malicious traffic. IDS and IPS logs are created any time an event rule is matched. The files can include IP addresses, port numbers, and customized rules. You can select the log output method and format that best suit your needs. A few formats include unified output, which is composed of machine-readable binary files, and comma-separated values that are easy to import into a spreadsheet or database program.
When you're working with log files, it's important to know about the system logging protocol Syslog. Syslog standardizes the messages used to communicate with a log server. This makes it easier to monitor network devices. Syslog provides a centralized location to collect events from multiple sources. Messages that use this protocol include things like a timestamp, a device ID, a severity rating, and related signatures.
Output can also be directed to a security information and event management system. Whichever method you use, it's important to monitor all alerts in real time. As an analyst, it's your job to identify alerts that need to be bumped to security incident status.
Keep in mind that there are no standard log file formats between systems. However, most log collection and analysis software can adjust to multiple file types and formats.
Summary 04:09-04:21 That's it for this lesson. In this video, we discussed best practices for log review, and we talked about several types of logs.
4.5.2 Log Review Facts
This lesson covers the following topics:
- Log overview
- Event logs
- View log events
- Time synchronization
- Logging levels
Log Overview
Logs, or audit trails, are a record of events on a system. Logging capabilities are built into operating systems, services, and applications. Log entries are generated in response to configuration changes, changes in system state, or in response to network conditions.
Log ingestion describes collecting log data from multiple sources, such as authentication servers, application servers, web servers, and databases, and storing it in a centralized location for analysis. It often involves using logging tools like Splunk and Logstash to collect and process log data from these systems to provide a comprehensive view of the infrastructure and the activities taking place within it.
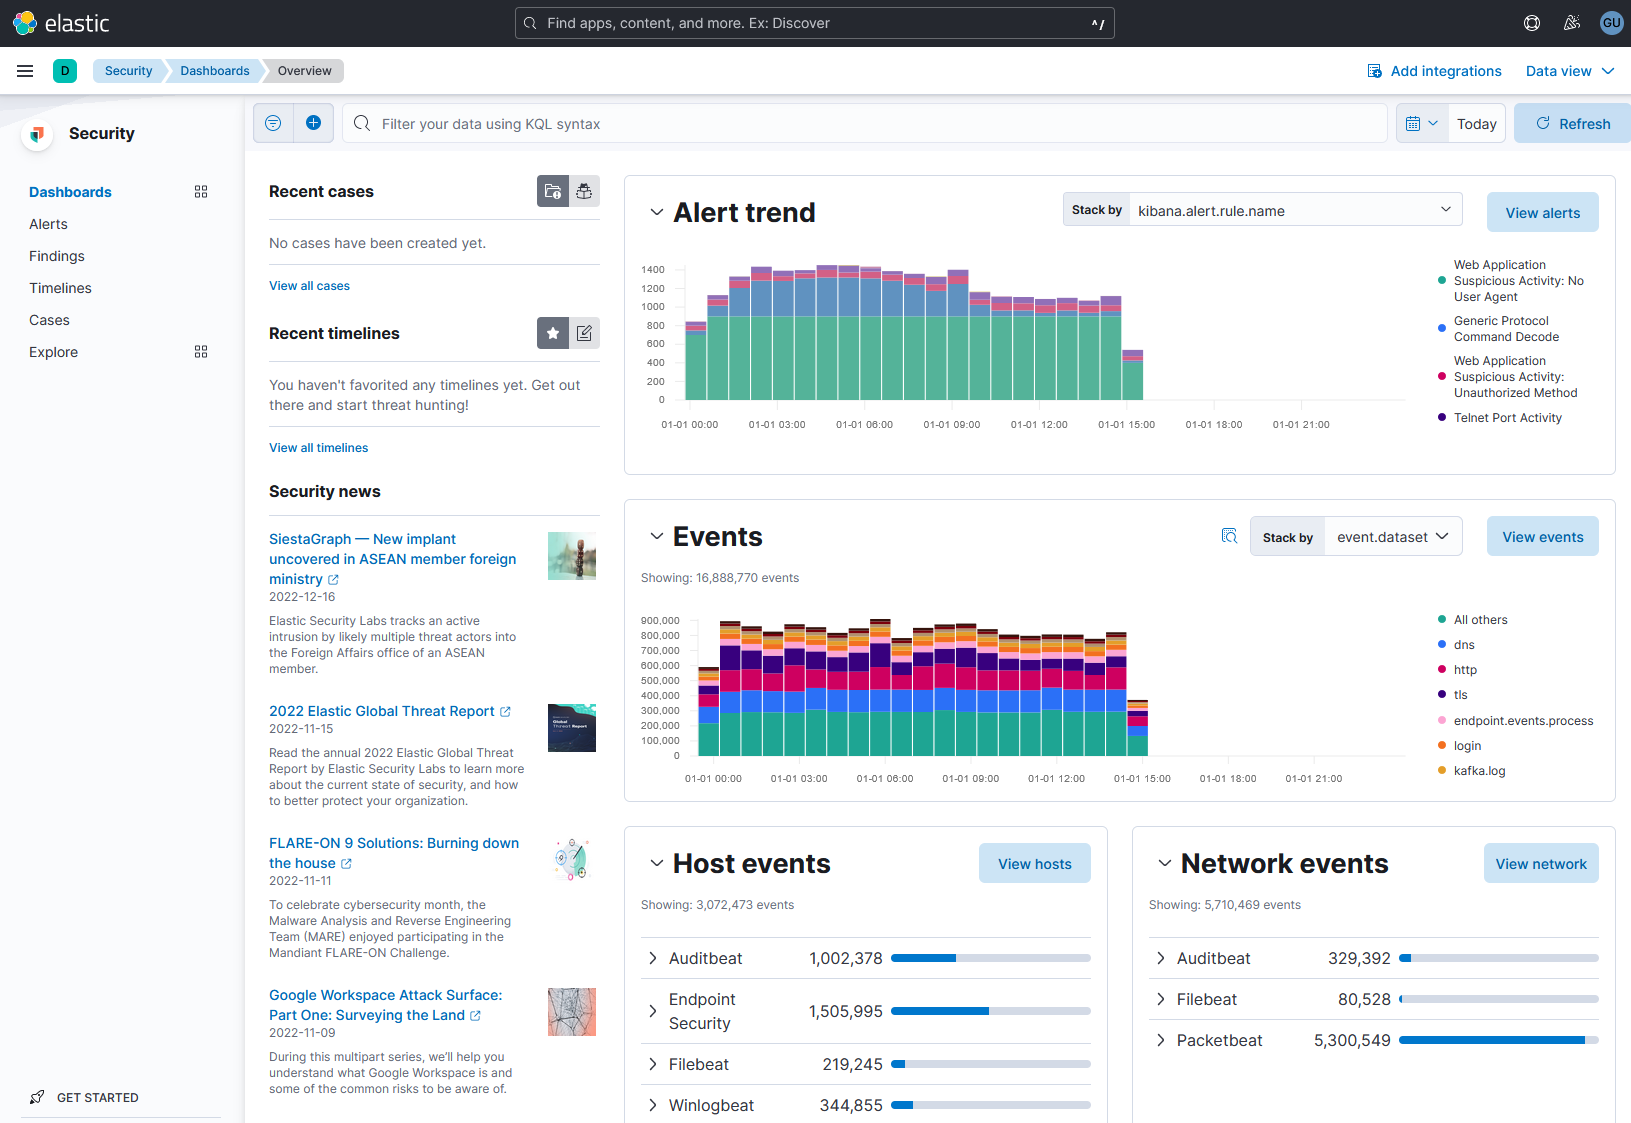
Description
The search bar at the top reads, Filter your data using K Q L syntax. The dashboards tab is selected from the security menu on the left. A section on the right of the security menu lists the recent cases, recent timelines, and security news. On the right, 2 bar graphs are displayed for alert trend and events. The details regarding host events and network events are displayed below.
Screenshot of elastic security dashboard used to enrich log data. (© 2023 Elasticsearch B.V., used here under license).
Be aware of the following when planning a logging strategy:
- Logging requires system resources (processor, memory, and disk). Carefully assess the amount of logging you need for system security.
- Logs must be analyzed to be useful; only by looking at the logs are you able to discover problems. Depending on the log type, additional tools might be available to analyze logs for patterns.
- There is no standard log file format between systems.
- The IETF Syslog standard is a standard for managing and sending log messages from one computer system to another. The software can analyze Syslog messages and notify administrators of problems or performance.
- Logging can be a preventative method of security.
- If users know they are being monitored by the system, they are less likely to perform unauthorized or illegal activities.
- A banner message immediately before login reminds users that the system is being audited.
- Some forms of auditing might be a violation of user privacy. To avoid privacy conflicts, make sure that auditing applies to all users and is clearly communicated.
Be aware of the following facts when implementing logging:
- Logs should show a narrow view of information. If a log contains too much information, issues could be lost or harder to spot in the information.
- By default, some logging is enabled and performed automatically. To gather additional information, you can usually enable more extensive logging.
- Violation logging uses a defined threshold for specific events or counters. When activity exceeds the threshold, an action is logged.
- You should always promptly resolve or report any suspicious or unauthorized activity revealed in the logs.
The following table identifies types of logs:
| Log Type | Description |
|---|---|
| Access log | An access log, or a security log, records information-related system access, such as:
|
| Performance log | A performance log records information about the use of system resources, such as printers and servers. With performance logging, system activity is recorded at regular intervals. |
| Firewall log | A firewall log identifies:
Firewalls collect a large amount of data and typically have limited storage space. Collect all data so the information is not lost due to lack of storage. |
| Web application firewall (WAF) log | A web application firewall is used to filter HTTP traffic at the Application layer. A WAF does the following:
|
| Intrusion detection system (IDS)/intrusion prevention system (IPS) logs | An IDS is used to analyze packets for malicious traffic. It is a passive system that alerts administrators of high-priority events. An IDS can also be used as an IPS. An IPS is an active system that blocks malicious traffic. IDS/IPS logs are created anytime an event rule has been matched. The files can include:
|
Event Logs
On most operating systems, you can track and log a wide range of different event types. Logging everything is not practical from either a logging or analysis perspective. You should only log those types of events that are of most interest to your security operations.
The following table identifies the types of events the log should include:
| Event | Captured Data |
|---|---|
| Internet connection | Internet connection log data includes the:
|
| System-level | System-level data includes:
|
| Application/service log | Application/service logs can include virus logs and DNS logs. Log data should include:
|
| User-level | User-level log data includes:
|
View Log Events
Beware of the following tools used to view log events in Windows:
| Tool | Description |
|---|---|
| Event Viewer | A GUI-based program used to view logs about programs, system events, and security. Each entry is listed as a warning, error, or information event. Events are added to the following logs:
|
| PowerShell Get-Eventlog | Running the Get-Eventlog cmdlet from PowerShell lets you view the events and event logs from local and remote computers. By default, Get-EventLog gets logs from the local computer. To list all the logs currently being captured on the specified system, enter Get-Eventlog -logname * To list the contents of the specified log, add the name of the log file. Listed below are some examples:
|
Time Synchronization
Time synchronization ensures that computer systems have accurate system time and time-related information by synchronizing the system time with a reference time source, using Network Time Protocol (NTP), an atomic clock, or a global positioning system (GPS). Time synchronization is essential to establish a clear event order.
Logging Levels
Logging levels are categories of severity used to categorize log events. Each logging level is associated with a numerical value that can be used to sort and filter log events.
Logging levels refer to the severity or importance of a log message. Common logging levels include the following:
| Level | Description |
|---|---|
| DEBUG | Used for debugging purposes. |
| INFO | Used for informative messages. |
| WARNING | Used to indicate a potential problem. |
| ERROR | Used to indicate a serious problem. |
| CRITICAL | Used to indicate a critical problem. |
Syslog uses eight logging levels, starting from the most severe (level 0) to the least severe (level 7).
| Level | Description |
|---|---|
| 0 Emergency (emerg) | System is unusable |
| 1 Alert (alert) | Immediate action required |
| 2 Critical (crit) | Critical conditions |
| 3 Error (error) | Error conditions |
| 4 Warning (warn) | Warning conditions |
| 5 Notice (notice) | Normal but significant conditions |
| 6 Informational (info) | Informational messages |
| 7 Debug (debug) | Messages helpful for debugging |
Another useful logging level is TRACE. This level is typically used for very detailed logging that is useful for debugging. It is generally not used for production applications, as it can generate overwhelming amounts of log data and cause negative performance impacts.
Custom logging levels can also be defined to provide more granular control over the logging process. For example, an application may define a "SECURITY" level to track security-related events.
4.5.3 Configure Centralized Logging with Cisco Devices
Click one of the buttons to take you to that part of the video.
Configure Centralized Logging with Cisco Devices 00:00-00:18 In this demo, we configure a simple syslog.
Looking at our topology, the device connected to Router 1 is the syslog server. We'll enter commands from Router 2, down here, to send the information up to the syslog server.
Aggregate Syslog Traffic 00:18-00:41 Keep in mind that all logs go to the console by default, but we can send it to a server. That way, we can aggregate the information instead of it going to a dozen, two dozen, 50, 100, or more routers.
We can have that information sent to one central location. That way, the system administrator can look at these logs in one place, which makes things a lot easier for network administration.
Turn on Syslog 00:41-01:48 To enable syslog and tell it where we want to send this information, we need to get into global config. We have to enter only a couple commands. First, let's type 'logging'. Then we specify the IP of where we're sending it. We'll type '10.10.1.2' and press Enter. That command enables logging for us.
Next, we specify what we want to log. Let's enter, ‘logging trap debugging'. That's all there is to it. We are now logging debugging.
We'll enter 'show run'. You can see that all debugging traffic will be sent to the computer ending with the IP address 1.2.
Now let's look at the running configuration of the commands we entered. All debugging is now going to the syslog server.
We don't have the syslog server set up to receive system logs because that is not part of this demonstration. But as far as configuring Cisco routers, that is all there is to it.
Now, of course, you wouldn't do this from only one router. You're going to do this for all your routers, so all the information is sent to the server the network admin has configured. The system admin can then go through the logs for troubleshooting and other admin activities.
Summary 01:48-01:58 That's it for this demo. In this demo, we configured centralized logging on a Cisco router.
4.5.4 Use pfSense to Log Events
Click one of the buttons to take you to that part of the video.
Logging Events on pfSense 00:00-00:31 In this demo, we're going to spend a few minutes viewing log files on our pfSense security appliance. A log should act as a red flag that something is happening potentially something bad. By reviewing your logs on a regular basis, you'll get an idea of the normal traffic on your device. In reality, no one likes to spend hours a day viewing log files. Typically, you would want to configure a syslog server so that all your logs from all devices go to one place to be consolidated for easier analysis.
System Logs 00:31-01:24 To view logs on pfSense, we first need to go to Status and then down to System logs. Once we're in System logs, we see the General tab. Like I said, viewing logs isn't the most exciting thing to do, but it's necessary. Under the General tab we can see that we have a time stamp, a process, a PID or process ID, and a message about the log. Let's move on to Gateways.
Under Gateways, you can see that I only have one Gateway on this test system. Looks like my system is grabbing an IP for the WAN network interface. You might be thinking that if it's grabbing an IP from a WAN, shouldn't this be a public IP? That answer is yes, but I do have a test network set up and that network is connected to my regular LAN.
We also have our Routing logs here. Next to that I have my DNS Resolver logs. Finally, we have our Wireless logs. I don't have any Wi-Fi currently configured with this device, so there are no logs for our Wi-Fi.
Firewall Logs 01:24-03:06 I'll move over to my Firewall logs. This is generally where you might look for malicious attacks directed toward your network. You'll see information down here with more details. As I scroll down, you can see the different source IPs that triggered the log. This one here, 172.16.1.100, is from my DMZ trying to get out to the WAN.
Dynamic View shows us a bit less detail. Down here I have some WAN traffic on port 5353. As you first get a system set up, you might want to familiarize yourself with the different ports that your firewall is logging. Some ports might be perfectly normal while others might not be. I wasn't familiar with port 5353, but a quick web search told me it's for multicast DNS and is safe. So now I know what it is.
Summary View gives us a bunch of graphs that can be helpful to get a quick visual of things. Here I have my different interfaces. I have three in this device one for my LAN, one for the DMZ, and one connected for the WAN.
I have my protocols and it looks like most of my traffic is UDP.
Down here a little further, I can see the source IPs of what's been triggering the logs. All the 192.168 addresses are from the WAN interface and the 172.16 address is my DMZ.
I have the destination IPs in this next graph. I have my source ports next. Finally, I have destination ports. Here you can see UDP/53 listed. That is my DNS traffic.
So, it's good to get familiar with what your typical traffic looks like. This is called creating a baseline. This isn't covered in this demo, but it should be one of the first things you do when setting up new devices.
DHCP Logs 03:06-03:31 My next set of logs are DHCP logs. Here you can see who's getting IPs from the DHCP server. Not only can you see who's getting IPs, but you can see the DHCP acknowledgement, the DHCP requests, and down here you can see that DHCP renewed an IP for one of the clients. All of this is useful information if you're troubleshooting DHCP or need to see what devices are connecting to your network.
Captive Portal Authorization 03:31-03:52 I had this device set up as a captive portal at one time so that we could see all the events that are related to it. As a quick review, a captive portal is a web page you're taken to, such as in a hotel or other public place, before you're given access to the internet. You typically must agree to the terms and conditions before being allowed to proceed. You might have to enter a password as well.
Other Logs 03:52-04:12 The next four tabs IPSec, PPP, VPN, and Load Balancer have no log files because I don't have any of those services running on this device. But I do have OpenVPN configured. Down here you can see all of those log files. I do have some NTP logs, or Network Time Protocol logs, here.
Log Settings 04:12-05:40 The last thing I want to look at is log settings. If you noticed as we were viewing logs, there were only fifty shown. Here is where we can change that if needs be. As I scroll down, you can see other settings that you can configure. You can even reset your logs.
Here at the bottom is where you can configure pfSense to send these logs to a syslog server. I'll check this box to enable it. When I do, I'm presented with some more settings specific to remote logging.
I can be specific about which interface I want to log. I can log all of them, or just one. I could just log my WAN events if that's all I'm concerned about.
I can choose to only have IPv4 logs or only have IPv6 logs sent. Here I would put the IP and port of the remote syslog server that's configured to receive those logs. I don't have a server set up for this demo, but if I did, this is where I would tell pfSense to send the logs to. The format would be something like 10.10.10.100, and it would be port 514. Port 514 is the port that pfSense uses by default to send logs to the syslog server.
Now I would need to tell pfSense what I want to send. I don't like information overload. I only want to send the logs that I actually need. So I might only want firewall events, DNS events, DHCP events, and VPN. In my case, that's OpenVPN. I would then click on Save and, if my syslog server is configured, it'll start to receive log files from my pfSense security appliance.
Summary 05:40-06:00 That's it for this demo. In this demo, we examined the logs on our pfSense security appliance. We viewed many of the different logs that can be collected. We then looked at settings and some things that we can configure. We ended by explaining how to send our logs to a syslog server.
4.5.5 Evaluate Event Logs in pfSense
Click one of the buttons to take you to that part of the video.
View DHCP Logs 00:00-00:33 Dynamic Host Control Protocol (DHCP) is the protocol that provides network clients with IP addresses and other network configuration settings, such as the default gateway, subnet mask, and DNS. You can perform passive reconnaissance on a network by looking at the DHCP log files on the DHCP server. These log files provide information, such as the network devices that have static IP addresses and the network devices that DHCP supplies IP addresses for.
Locate DHCP Logs 00:33-01:08 Let's first look at the pfSense device. This device is handling DHCP on the test network. Before starting this demo, we cleared the DHCP logs. We did that so we can start with a clean log file. We'll go to Status and scroll down until we see System Logs. Next, we'll click the DHCP tab. When we do, it tells us that there are no logs to display. That's perfect. We have a clean log file. Now let's create DHCP traffic and see what the log file looks like then.
Create DHCP Traffic 01:08-02:16 To create DHCP events for the logs, let's go to another machine on the network. We have a Kali Linux system here. We'll use that to create DHCP traffic. We're using that machine because it has Wireshark on it. We'll use Wireshark to see what happens when we create traffic.
On the menu, we'll go to Sniffing and Spoofing. From that list, we click Wireshark to open it. We'll type the password to authenticate and run Wireshark. All right, Wireshark is open. We want to use eth0. We'll click the Shark Fin to start capturing traffic. OK, it looks like that is running. Now let's open the terminal window.
We want to create traffic. We can do that by releasing the IP address. To do that on Linux, we'll type sudo dhclient -r' and press Enter.
We'll use the Up arrow key to get back to the previous command, back space to get rid of the -r and press Enter once again. That should have created DHCP traffic. To be sure, let's look at Wireshark and see what happened there.
Filter Results 02:16-03:21 Let's minimize the terminal window. That puts us back into Wireshark. You can see traffic here. Let's create a filter to see only the DHCP traffic. We'll first stop the scan by clicking the red square. We'll type dhcp' here to apply a display filter for DHCP traffic. When the background turns green, you know you have typed a valid display filter. Press Enter.
Now let's look at what we have. The first thing we did on the Kali system was release the IP address. You can see Wireshark captured that here in this first line.
When we requested a new IP address, the DHCP process happened. Remember from the basic networking courses, there are four phrases of DHCP operations: server discovery, IP lease offer, IP lease request, and IP lease acknowledgement. These stages are often abbreviated as DORA for discovery, offer, request, and acknowledgement. This is what we were expecting. Is that what the logs on the DHCP server record? Let's take a look.
DHCP Server Logs 03:21-04:10 We're back on the pfSense system. We'll refresh the page. We have entries in the DHCP logs. Let's look at them.
The first line is the DHCP release. We saw that on Wireshark. This is when we ran the command dhclient -r to release the DHCP address from the Kali system.
After that, we ran the command to renew the IP address. These next four lines are the result of that, as we saw in Wireshark. We have the discover, the offer, the request, and then the acknowledgment. All these from the IP 10.10.10.183.
Now if you have not checked logs for several days, there could be hundreds or thousands of entrees here. Remember, we cleared the log files before the demo to make this look nice and clean so it would be easier to see what is going on.
Summary 04:10-04:31 That's it for this demo. In this demo we looked at log files. First, we created DHCP traffic from a client and we verified the traffic in Wireshark. Then, we looked at the logs on pfSense, which is also the DHCP server on the test network.
4.5.6 Configure Collector-Initiated Subscriptions
Click one of the buttons to take you to that part of the video.
Configure Collector-initiated Subscriptions 00:00-00:38 In this demonstration, we're going to practice creating collector-initiated subscriptions. In order to do this, we need a source computer; a computer that generates events. We also must have a collector computer. This is the computer that will aggregate events from various source computers.
Aggregating events is an efficient way for an administrator to monitor network status. You can setup a log host on your network. If you need to check events that are occurring on other computers in your network, you can check the collector computer, your log host, and see events from computers in your network. You don't have to go to or log in to each computer.
Configure Source Computer 00:38-01:36 This Windows system here is named PC-ENT. This is going to be the source computer. It is the system that will generate events collected by the collector.
This other system, PC02-1903, is going to be the collector computer. It will aggregate events from the source computers.
Let's switch back to the source computer PC-ENT. First, we'll configure collector-initiated subscriptions on the source computer. So, we'll open a command prompt on the source computer. We must run with an elevated command prompt.
At the command prompt, we're going to type 'winrm qc'. Press Enter. This command loads the WinRM service using the quick config option. We'll enter 'Y' for yes to all the prompts displayed to start the WinRM service. Note that the appropriate exceptions have been added to our firewall rule so that traffic can go through.
Add Source PC to Event Readers Group 01:36-02:41 The next thing we must do is add the collector computer to the Event Log Readers group on this computer. To do this, we launch Computer Management. We will run it as an administrator user.
We'll go to Local Users in Groups. Click Groups. Locate the Event Log Readers group, double-click and click Add. Now click Object Types and select Computers. By default, Computers is deselected. Click OK. Click Advanced and Find Now. Now we'll scroll though the list displayed here and locate the computer account or the computer that will be the collector.
In this case, it is the PC02-1903 computer. This is the collector. Let's select it. Click OK. OK again. Now this computer now has permissions to view the event log on this source system which is PC-ENT.
Let's close Computer Management for now. So, the source computer is ready to go. The next step is to configure the collector computer.
Configure Collector Computer 02:41-05:50 We've switched back to the PC02-1903 computer which is the collector. As on the other system, we need to open an elevated command prompt. Click Yes on User Account Control.
On this system, we must run the Windows Event Collector Utility. We type 'wecutil qc' and click Enter. The qc parameter specifies the quick config option. This command sets up the Windows Event Collector on this system and starts the associated service.
We'll just say Yes to all the prompts to start. It tells us that the Windows Event Collector Service was configured successfully. The next step is to create the subscription. The subscription allows the collector to grab events from the event log on the source computer. We do this in the Event Viewer.
Type 'event' in the Search box. Right-click Event Viewer and run it as administrator. You want to click Subscriptions at this point. None are currently defined. We'll right-click and select Create Subscriptions. For subscription name, we'll enter 'Win10 Subscription'.
For Destination log, we want this set to Forwarded Events. Then under Subscription type and source computers, we must decide if we are configuring a Collector initiated subscription or a Source computer initiated subscription.
In this demo, we are creating a collector-initiated subscription. Therefore, we're going to leave the default option selected and click Computers. Here we must specify the computers we want to collect from. We'll click Add Domain Computers > Advanced > Find Now. Here we can select the computer we want to grab events from.
Remember, we configured PC-ENT as a source computer. So that's the only one we can use right now. Double-click it. Click OK. So, now this system has been added as a computer that we're going to grab events from.
Next, let's specify the events we want to grab from PC-ENT. Under Event logs, we'll specify the event logs we want to grab events from. We could select all of them if we wanted to, but for our purposes today, let's just grab Application.
You could select Security and System as well. That would work fine. Next, we must specify which Event level you want to specify. For example, let's specify Critical and Warning. By doing this, we'll transfer events that are of a warning level or critical level.
That makes sense. If we're gathering events from lots of different computers around the network on this collector computer, we probably don't care about these other types of events. We can end up with information overload.
Instead, we want to see things that we need to take care of right away. Click OK. Click OK again. Notice that we have a new subscription created and it is active. We can tell that it's active because it has a little green check mark to it.
Our subscription has been created and the forwarded events will start to show up on the collector system under Windows logs in Forwarded Events. However, we probably won't have any forwarded events right now. Why? Because we are filtering for critical or warning events. Those don't happen very often so there is nothing here. If we were to wait for an extended period, we would start to see some events here.
Summary 05:50-06:00 That's it for this demonstration. In this demo, we configured a collector-initiated subscription.
4.5.7 Configure Source-Initiated Subscriptions
Click one of the buttons to take you to that part of the video.
Configure Source-initiated Subscriptions 00:00-00:09 In this demonstration, we're going to look at how you can configure a source-initiated subscription.
Configure the Source Computer to Send Events 00:09-02:10 The first step in setting up a source-initiated subscription is to configure the source computer. This computer here, the Windows 10 system, is the source computer that we're going to gather events from. We will send events from this computer to the collector system.
To do this, we'll configure the Windows Remote Management Service on the source computer. Let's open an elevated command prompt. Type 'winrm qc -q' at the prompt. Notice that the WinRM Service is already running. If it weren't, this command would have started it.
We'll configure the Windows Remote Management Service on the source computer to accept remote requests from other network computers.
The next step is to configure the source computer with information about the collector computer that it's going to send events to. The beauty of source-initiated event subscriptions is that we can use Group Policy configure it.
We don't have to configure the collector computer with information about each computer on the network that's going to send events to it. By way of contrast, if we were to configure a collector-initiated event subscription, we would have to tell the collector computer the name of every computer that it was gathering events from.
For a source-initiated event subscription, all we do is configure the collector once. Then, each source computer system gets the appropriate information through Group Policy and automatically connects to the connector.
Let's type 'gpedit' in the Search box and select Edit Group Policy.
You'll note that during this demonstration, we're using the Local Group Policy editor. It's done simply for convenience. It doesn't matter if you set up these policies using your Local Group Policy, or if you set it up on the domain using Group Policy.
These settings are in the same place; they work the same. We're doing it this way for convenience. If you were working on a large network with lots of Windows systems, you would not use the Local Group Policy editor to do this. It'd be much easier to configure the policies at the domain level. That way, they're automatically pushed out to each computer when the computer logs in to the domain.
Configure Event Forwarding 02:10-04:01 Under Computer Configuration, let's go to Administrative Templates. Find Windows Components and expand it. Then locate Event Forwarding. Under Event Forwarding, there's a policy named Configure target Subscription Manager. Double-click it to edit it.
First, let's enable the policy. Then let's tell it what SubscriptionManager to use. In other words, we'll tell it the collector system that it needs to send events to.
By the way, any time you're working with a policy within Group Policy and you're not sure what it does or how to configure it, always look at Help. Help provides very useful information.
For example, it tells us the syntax that we should use when we're setting up the SubscriptionManager. We'll click Show. Then, in the Value field, enter 'Server=HTTP://' followed by the host name of the collector computer.
In this demonstration, we're going to use the domain controller as the collector computer. You would never, ever do this on a real network. You would have a dedicated collector system that didn't do anything else. But, for what we're doing here today, it'll work well enough.
Now, the name of the collector computer is 'SRV2019.CorpNet.xyz'. Notice down here, if you're using HTTPS, you must specify the port number to use. The port is 5986.
We're not going to use HTTPS in this demo. You could if you wanted to. Because we're not using HTTPS, we don't need to specify a port number. All we must do is type '/wsman/SubscriptionManager/WEC'. Click OK and click OK once more to enable the policy.
Notice that the policy state has now changed to Enabled. Let's close the Group Policy editor at this point.
Now, we need to switch over to the server system.
Configure the Collector Computer to Accept Events 04:01-07:29 As we said a minute ago, this server system is going to be the collector computer. Yes, it is a domain controller; no, you should never do this on a real network. Works great for doing this demo though.
To set up the collector system, let's open an elevated command prompt. On this collector system, we need to run 'winrm qc -q' just like we did on the source system. Press Enter. It tells us that this command has already been run and this service is already running on this machine. That's good.
Now, the next thing we do is run the wecutil command. This enables the Windows Event Collector on this system. We do need to use a couple of parameters with the command. We'll enter 'wecutil qc /q'. It tells us that the Windows Event Collector Service was configured correctly. We're ready to go.
The last step is to create the subscription. You can do this from the command line, using the wecutil command. If you want to do it the lazy way, and why not, you can use Event Viewer. That's how we're going to do it.
We're going to type 'event viewer' in the Search box and press Enter.
We'll right-click Subscription and click Create Subscription. The first thing we need to do is give the subscription a name. Let's name it 'Client Logs'.
Then, we must specify the destination log. In other words, when a source system sends an event to the collector, what's the collector going to do with it? Where will the collector put it? By default, it's set to go to Forwarded Events. We don't have to put it in Forwarded Events; we can put it in some other log if we want to. However, it's perfect in Forwarded Events. That's where we're going to put it.
Next, we must specify the type of subscription we're creating. Notice that, by default, it's set to Collector initiated. That is not what we want. We want to configure a source-initiated subscription. By doing this, our source systems can push out events to this collector computer.
Whenever that happens, the collector computer here will accept those forwarded events and put them in the Forwarded Events log. Click Select Computer Groups. Let's click Add Domain Computers, click Advanced, and click Find Now.
The computer that we configured to be a source computer is PC-ENT. We'll select it and click OK.
If source computers we are going to accept events from computers that are not members of the same domain, then we would click Add Certificates. With certificates, you can trust each other and are able to encrypt the data as it's transmitted.
We don't want attackers to be able to sniff these events as they're transmitted across the wire. Attackers could gain valuable information from this transmitted data. We don't have to worry about that here, because the PC-ENT Windows 10 system we configured as the source and this Windows server system are all in the same domain. Click OK.
Then, we need to configure a filter for the events that we want to collect. We can specify an event level. Let's specify Critical and Warning. We don't want information overload, so we're not going to select any of the others.
Down here, we can specify the logs we want to accept forwarded events from. Let's select Application and System. Click OK to set up the filter and then click OK once more.
If we click Subscriptions in Event Viewer, we see the subscription we just created. We see that it is currently active. At this point, we just sit back and wait for events from the source computer to be sent to this collector system.
Summary 07:29-07:46 That's it for this demonstration. In this demo, we configured a source-initiated event subscription. We first configured the source machine to send events. Then we configured the collector system to accept events from the source system.
4.5.8 Log Events with Event Viewer
Click one of the buttons to take you to that part of the video.
Logging Events with Event Viewer 00:00-00:38 Let's take a look at logging. The main place to find logs on a Windows 10 system is Event Viewer. On Windows 10, we're going to go down to the Start window, right-click, and go to Event Viewer. Here, on the left-hand side, we have Windows Logs and Applications and Services Logs. And within Windows Logs, you can see Application, Security, Setup, System, Forwarded Events, and Subscriptions. If you set up a subscription from a remote system, those events show up in Forwarded logs.
System Log 00:38-01:16 The System log is a good place to look for operating system activity such as warnings, informational messages, and error messages. The System log is also a good place to begin troubleshooting. The Application log contains error messages and informational messages from applications running on the operating system.
You can double-click any event to get some more information about it. You'll see some explanations here. You can also go to the Details tab with more detailed information, and you can look at the XML view or the friendly view. It just depends on much detail you need.
Navigation 01:16-02:01 In here, on the right, you can see arrows. These arrows allow you to click through logs one by one. You can see it's going up and down. Another thing you can do is look at event IDs and research them to figure out a little bit more about the warnings and logs that you see. Okay, click Close.
If you right-click an event, there are a few things you can do. You can copy an event. You can save the selected event. You can go to the event properties. You can also attach a task to the event. If I click on this, I can go through and tell it what I want to do when that event occurs in the future, like send me an email or display an error message. That way, as an administrator, you can be a little more informed when an event occurs.
Custom Views 02:01-02:36 We can right-click a log to create a custom view. If we right-click our Applications log and go to Create Custom View, we're going to see that we can create a custom view for, basically, a filter for what we want to see. It'll create it as a separate custom view log over here. We'll check errors and then just click OK. We can name it here. We're going to call it Application Errors. We want it to show up under Custom Views. Click OK. You see it created it right here.
It went through and sorted out all the errors in the Applications log.
Filters 02:36-03:09 Another thing you can do that's also helpful is right-click a log and tell it to filter the current log. Do the same thing, go select Errors on the filter, and hit OK.
It automatically filters the log for us and narrows it down. You can see this is a simple way to do it if you need to do it once or twice. But if it's something you need to do repetitively, you might want to create a custom view for it. If we right-click Application again, we can clear the filter and go back to normal. It'll give you all the events again.
Properties 03:09-03:44 Let's look at log properties now. If we right-click a log and go to Properties, you can see that the properties include the log file path shown right here. You can see where the logs are stored. It also just displays the size of the log and what to do if the log fills up. You can set a maximum size for the log. You can tell it to override events as needed. For best practice's sake, we might want to select Do not override events. That way, if anything happened in the past that we need to see or need to be notified about, we can go back and look at it. We're going to go ahead and click OK.
Security Log 03:44-03:57 In addition to the application system log, there's a security log. The Security log is where your audited events go. So, aside from the default Windows logs, we have our custom views.
Administrative Events 03:57-04:24 Administrative Events is a new custom view that's created automatically. It very quickly shows us all the warnings and error messages for all of your logs simultaneously. This allows you to quickly troubleshoot any problems.
Also, we can see open application and service logs. There are many more events logged now than with prior versions of Windows. It includes, DFS, Hardware Events, Internet Explorer, and Key Management Service Microsoft.
Other Logs 04:24-04:59 If we expand our Microsoft folder and then our Windows folder, we can see all the logs in there. And while this might seem as if it's too much, if you're troubleshooting something specific, having the logs set up this way makes it very easy to find and narrow down what you're looking for.
For example, if you're having Bitlocker problems, you can very easily scroll down to Bitlocker-DrivePreparationTool, expand it, and look at the logs for Bitlocker drive prep. In the same way, if you're having Group Policy problems, you can scroll down to Group Policy and see your Group Policy logs and information.
Summary 04:59-05:17 So, these are some of the features of Event Viewer and how to use them. We went over what logs are available and what kind of information is in a log. We also went over how to set filters on your logs and create custom views.